01
Context
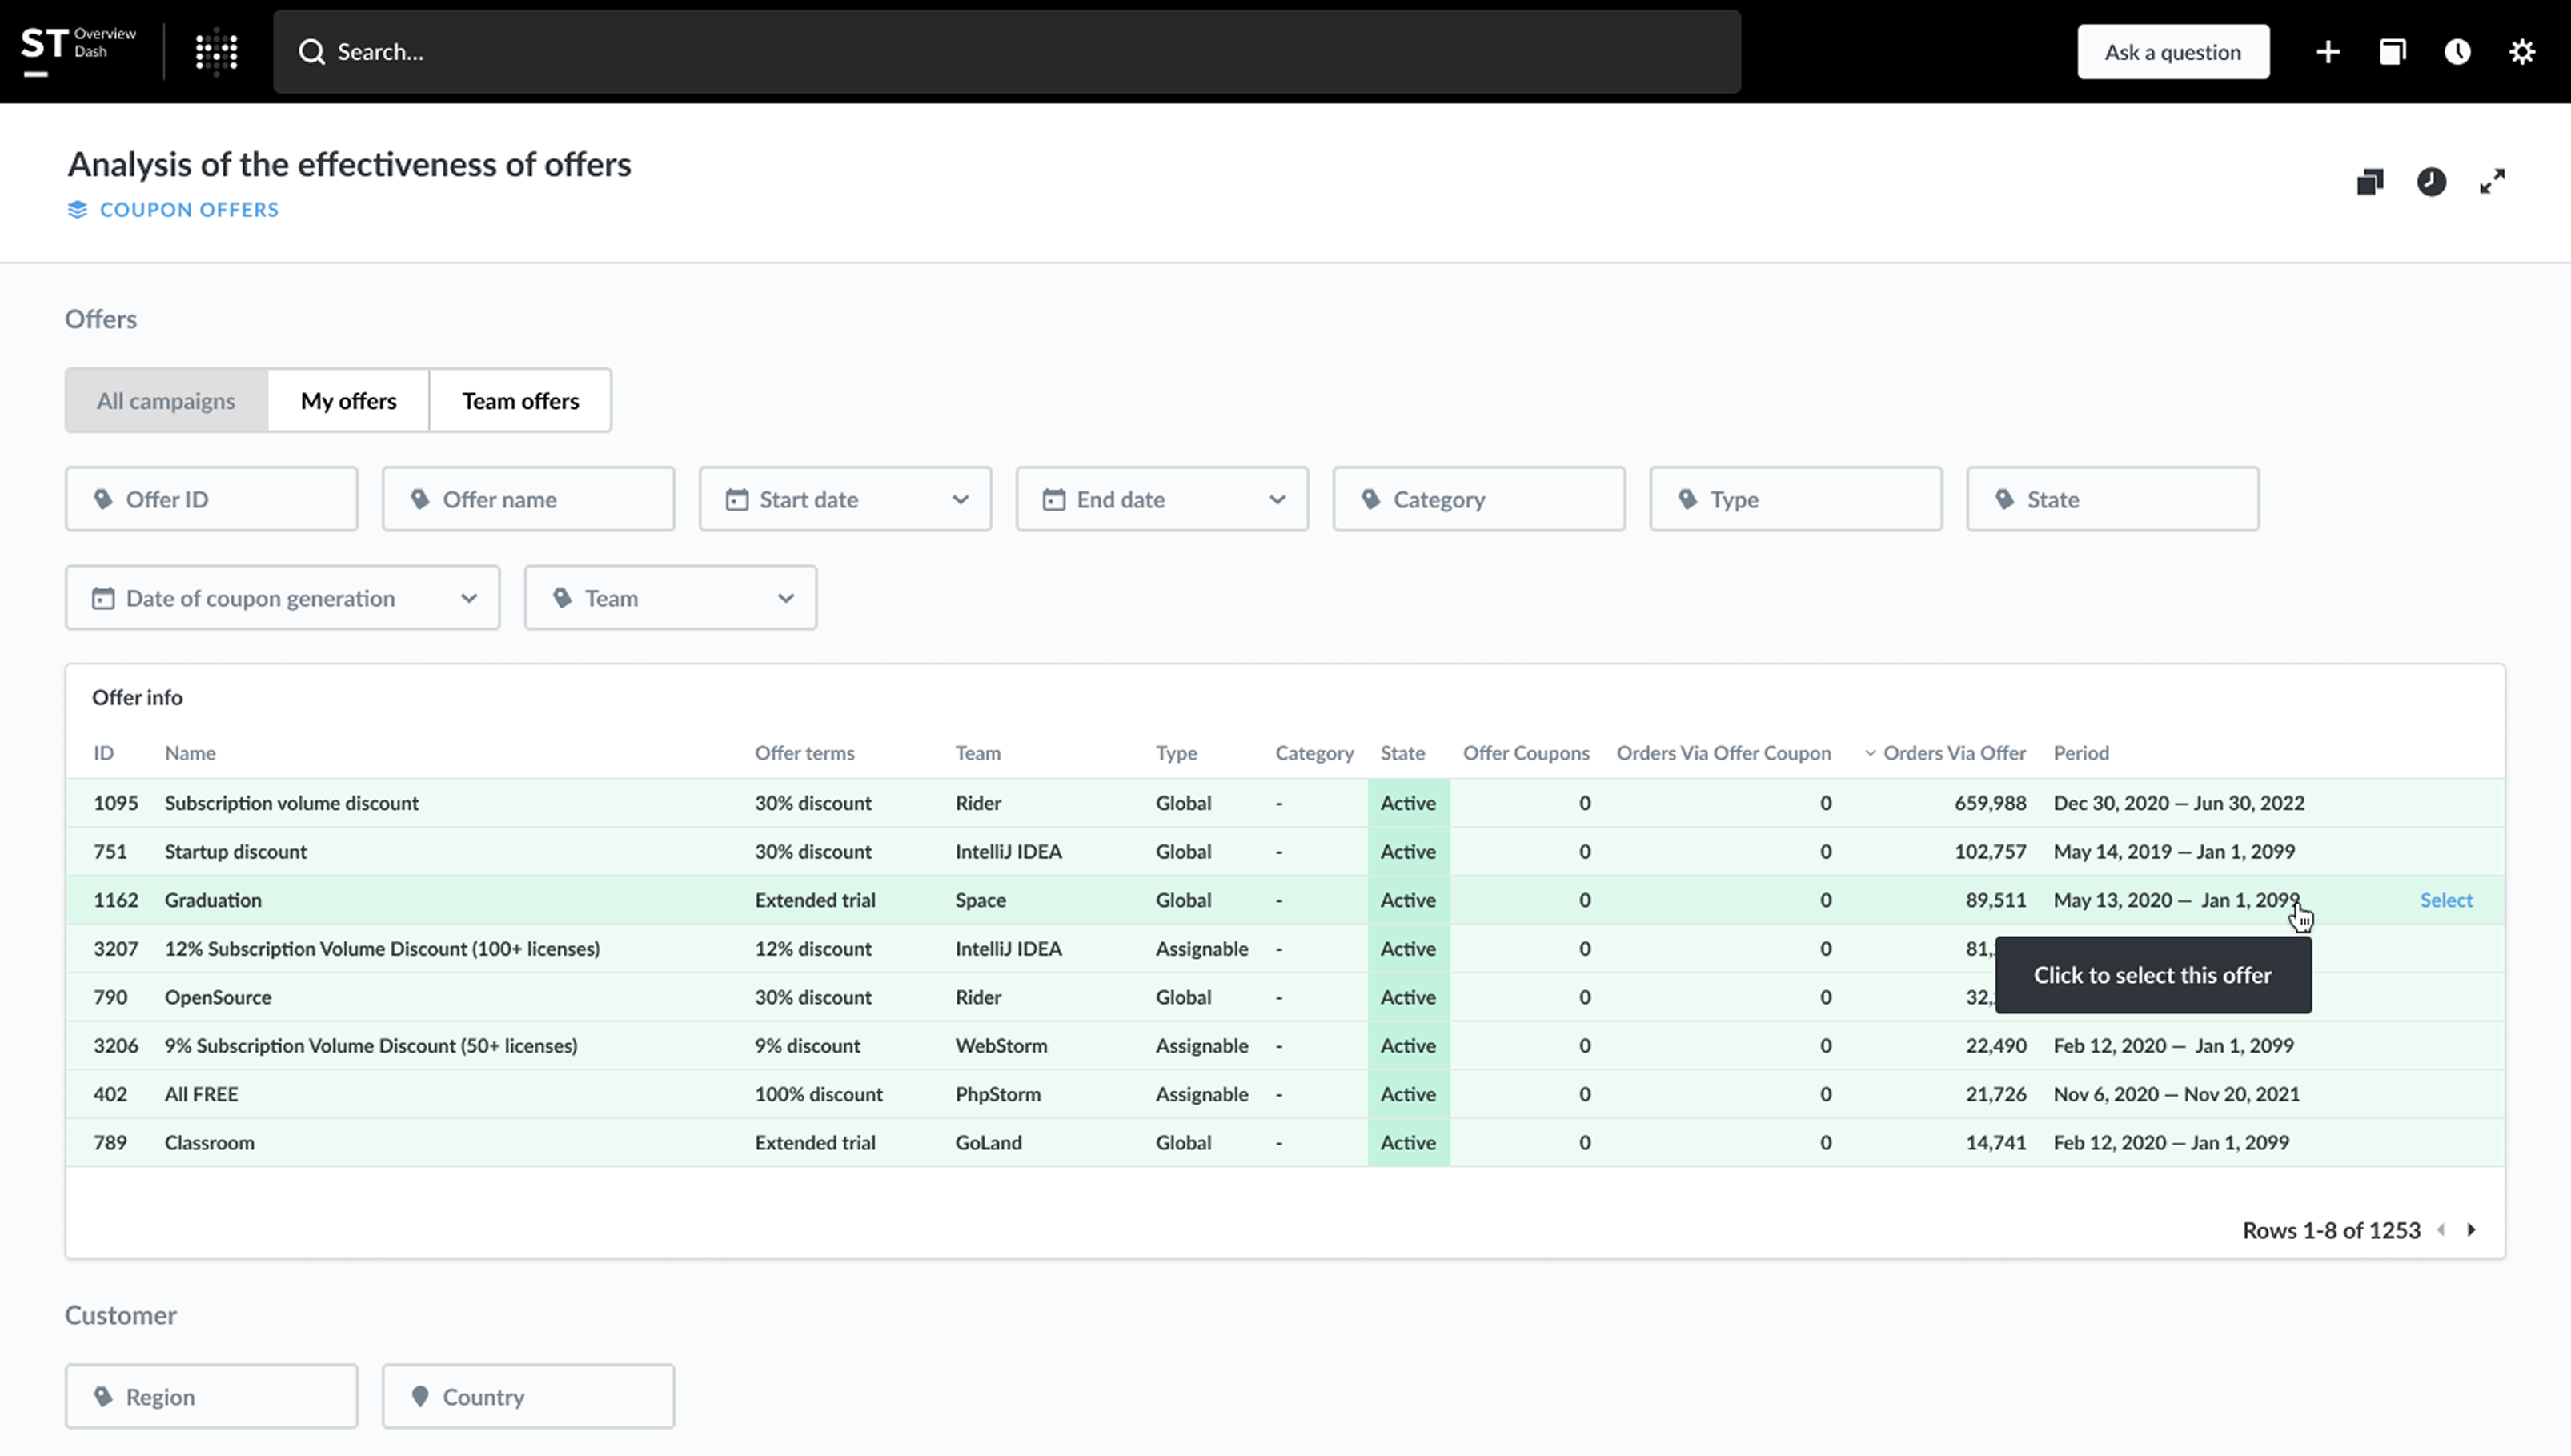
Research findings were presented in plain documents or dense collections of charts and tables. Teams had to extract the important signal on their own.
P/04 · JetBrains
A new way to present research: insight first, context second, detail when it is needed.
01
Research findings were presented in plain documents or dense collections of charts and tables. Teams had to extract the important signal on their own.
02
Make research findings clear to decision-makers without removing the depth researchers needed.
03
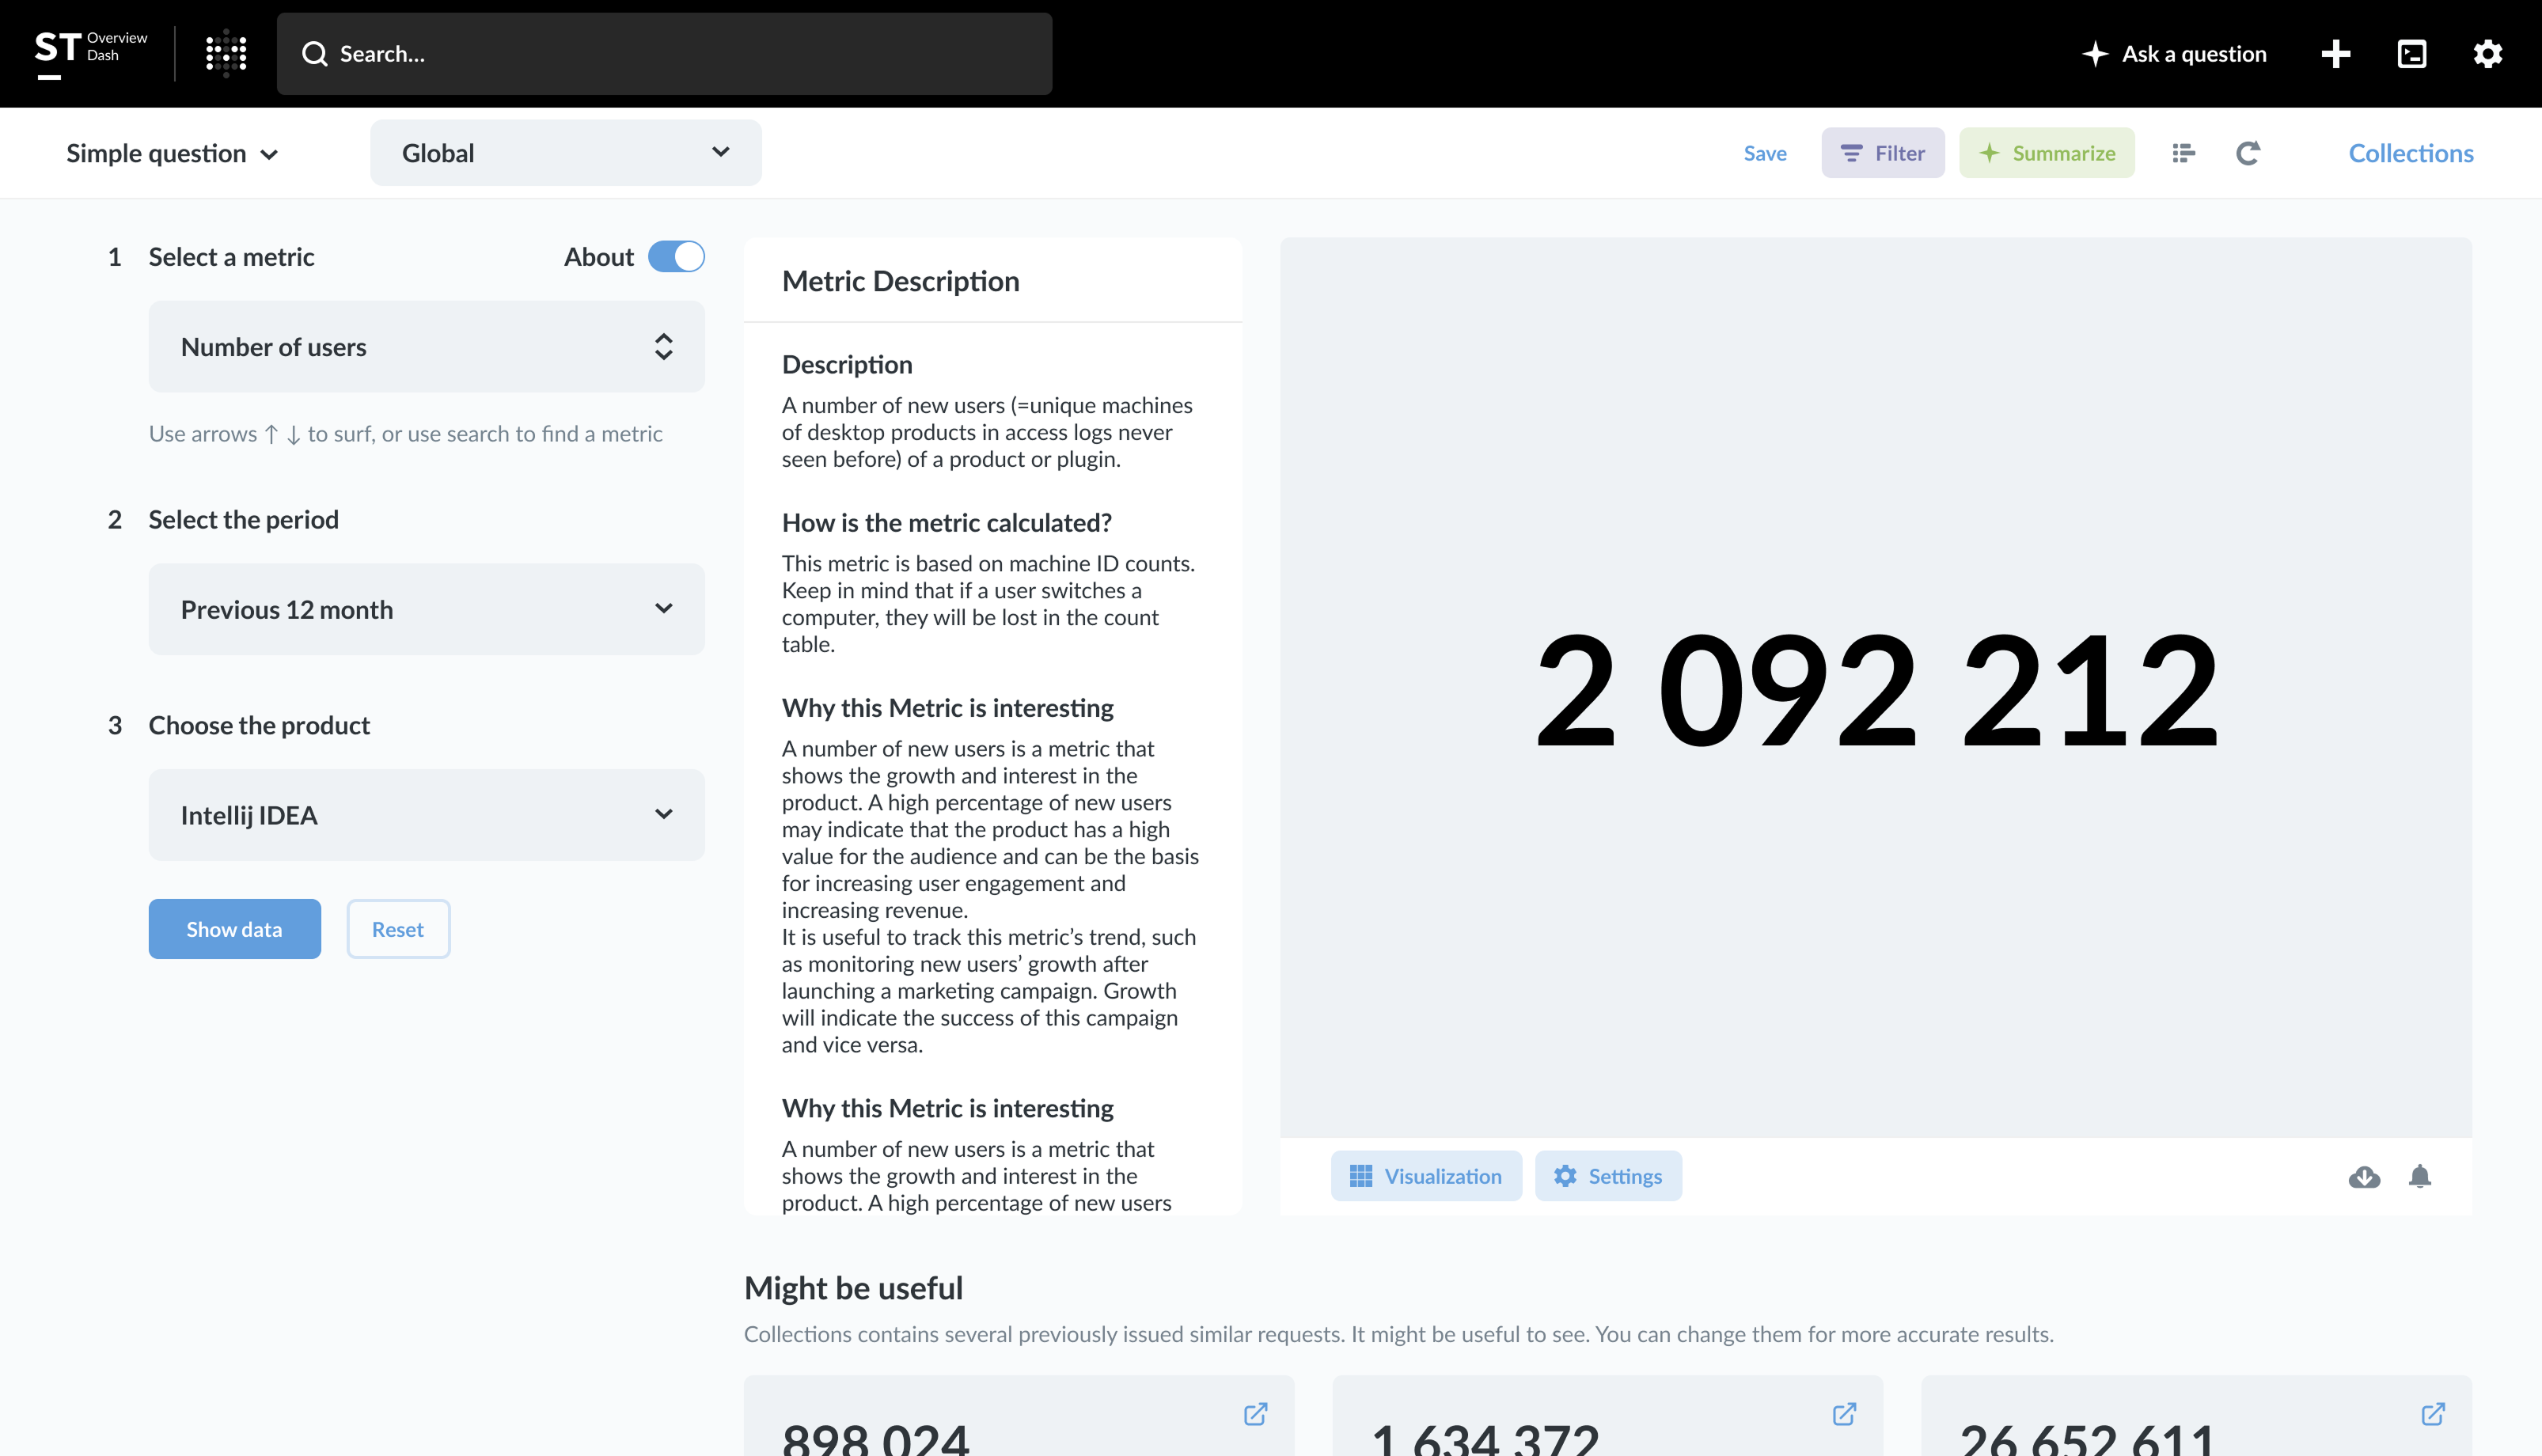
Designed a dashboard structure that moves from overview to detail.
Placed key findings and signals ahead of charts and tables.
Created a clear before-and-after example.
Coached researchers on focused presentations and decision-oriented storytelling.
Co-designed a new reporting system with another designer.
04
05 / What I took away
Since this project, I start a report not with charts, but with a question: what decision should a person be able to make after reading it?